Not a guess, proof.
Who got stuck where, who fell behind, which exam is hard. Every metric comes from real data; we never invent a number that is not there.
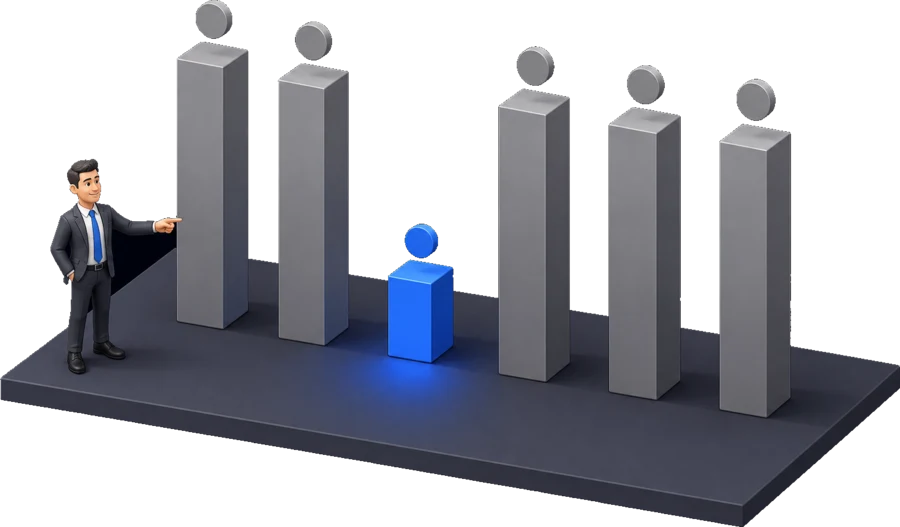
Honest reporting
A report is only as honest as its data. Instead of guessing and showing what we cannot measure, we simply do not show that metric. No inflated dashboards.
One screen, real data
Three report centers
Courses, learners and assessments; all in one panel, in the same language.
Saved views
Copy a ready-made view, add your filters, save it as your own.
Real KPIs
Completion rate, 30-day inactive, median duration, hardest exam; with a 30-day trend.
Export
Download any view as Excel or CSV; filters persist in the URL.
Four report centers, one panel
Each center has its own charts, a filterable table and a detail you can open per row.
Learners
Who is progressing, who has gone quiet; open one person and see their whole history.
Courses
Completion by course and module; where people drop off.
Assessments
Scores, attempts and the hardest questions, exam by exam.
Activities
What happened across the space, as it happened.
Filters that speak your language
Reports filter on your own data model, not just ours.
Your custom fields
Filter by department, branch, hire date, whatever fields your organization defined.
Click a cell, get a filter
Any value in a table can become the next filter; the drill-down is one click.
Filters live in the URL
Send a colleague the link and they see exactly the view you see.
Reports that send themselves
An automation step can mail a report to admins on a schedule or when something happens.
Base your decisions on real data.
Run on the real results you can measure, not on inflated charts.